Why product teams love A/B tests: from clinical trials to online experiments
Who this is forData analysts who can aggregate and visualize data but have never gotten a clear explanation of why A/B tests matter, and product teams weighing whether to adopt experiments.
TL;DR: A/B tests are not a tool that product teams invented. They moved the randomized controlled trial (RCT) from clinical trials to online settings. Observed data alone cannot separate cause from effect because of confounders, and the simplest way to remove them is random assignment. Clinical studies take years to recruit people, but online, traffic is the sample, so the same experiment can be repeated often. That is why they are loved. When experiments are impossible, there is causal inference. This article follows the 2025 Data Yanolja talk (a Korean data conference) in slide order.
Contents
- Why I gave this talk
- Observational analysis and its limits
- Enter experiments
- Experiments moved online: A/B tests
- When A/B tests aren’t possible: causal inference
- Conclusion: where to start
- Book recommendations
This article is a written version of “Why do product teams love A/B tests? (feat. causal inference),” a talk I gave at Data Yanolja 2025 (a Korean data conference). The talk video is available on YouTube. I used the video captions as the main text and the order of the 33 slides as the skeleton of the article. I did not add any examples or numbers that were not in the talk.
1. Why I gave this talk
I studied chemistry and biotechnology as an undergraduate and did research centered on experiments. After finishing a master’s degree in medicinal chemistry, I spent about three years in healthcare data analysis. Now I teach data. At work, I analyzed medical data for clients including marketing and medical affairs staff at pharmaceutical companies and researchers at hospitals. Within life sciences and healthcare, I went through analyses from several angles: undergraduate lab work, clinical trials, and National Health Insurance data analysis (South Korea’s public health insurance system).
I had three reasons for giving this talk.
- Clinical trial analysis and National Health Insurance data analysis were subtly different from each other as data analysis, and I wanted to organize those differences once.
- Job postings for product analytics roles consistently list A/B testing as important. I felt frustrated that I knew superficially why it matters but did not understand it at a fundamental level.
- As AI tools keep advancing, I thought organizing abstract theory would help in many ways.
The purpose of the talk was one thing: to understand why A/B tests were born. If after reading this, any of “let’s start with aggregation and visualization,” “let’s adopt this in our product,” or “let’s study causal inference” comes to mind, the purpose is achieved.
2. Observational analysis and its limits
When you learn data analysis, almost everyone starts with descriptive statistics. You compute means, variances, and standard deviations from data that already exists. It is intuitive, so everyone understands it, and it is less contentious when making decisions at a company. You may get asked “why did you take the average?” but you will not get asked “what is an average?”
In research terms, descriptive statistics fall under observational studies. They analyze data that was generated and collected naturally. A backend developer may object, “I’m the one who collected it, so what do you mean, natural?” but from a research perspective, that is the case. In research, the people who generate the data are called subjects or research participants. In web and app services, they can be called data generators. A characteristic of observational studies is that they carry almost no risk of harm to these people. Issuing a coupon and looking at changes in purchase rate does not hurt the people who received the coupon.
This kind of observational study is also called a retrospective analysis. If data collection started in 2020 and analysis happens in 2025, you go backward and analyze that period.
A mistake that happens often
Here is one of the most common mistakes in retrospective analysis. When I ran descriptive statistics on Office 365, the result showed that users who encountered more errors churned less. Strange, right? If you see many errors, frustration should build and you should leave, but the data showed the opposite. If you stop here and conclude “errors keep people hooked, so let’s show error messages freely,” it becomes a wrong decision.
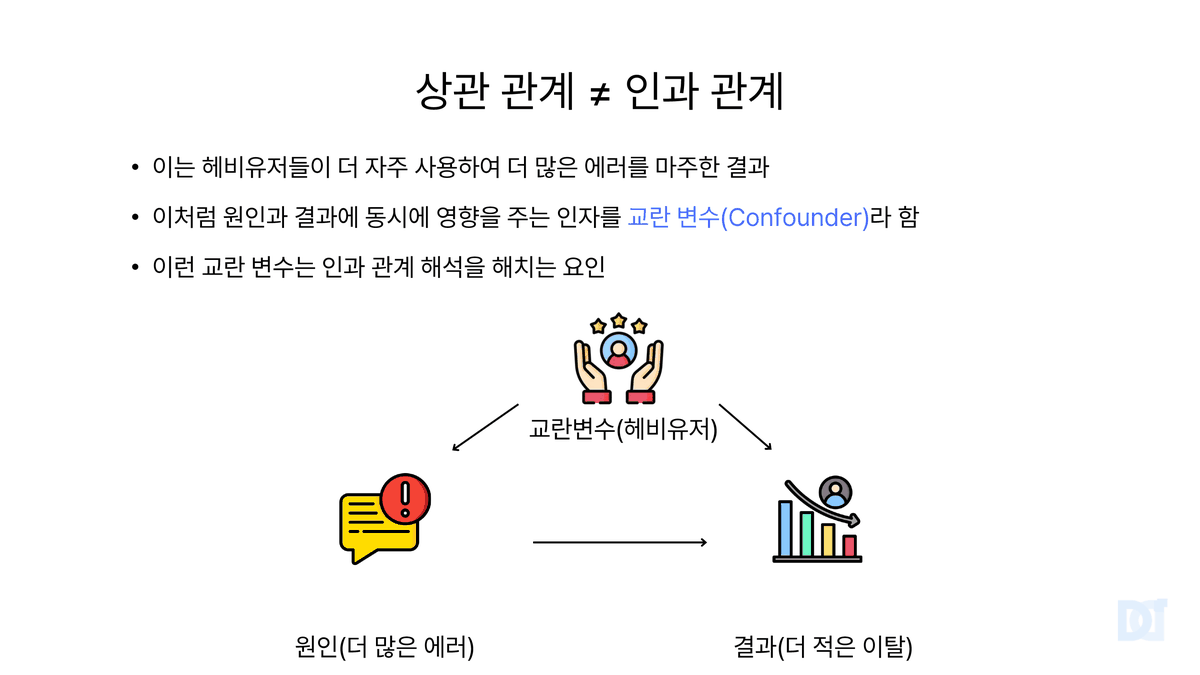
This is what it means to distinguish correlation from causation. A variable that affects both the cause and the outcome, making it confusing which is which, is called a confounder. When there is a confounder, the causal interpretation goes wrong.
Why don’t books just give the fix?
Many books cover confounders in an engaging way. A standard example is the correlation between shark attacks and ice cream sales. But it can be frustrating when a book explains confounders beautifully and does not tell you how to solve them. The reason is that it is not easy to isolate the pure effect of one cause on an outcome. One outcome involves numerous causes. A nudge does not make someone act immediately. The outcome comes from a combination of things like affection for the app and engagement. You want to pull out just one cause, like removing a single bone from a fish, and that is hard. In technical terms, this is called the endogeneity problem.
3. Enter experiments
Experiments were introduced to solve the endogeneity problem. If you understand the diagram below, the talk has succeeded.
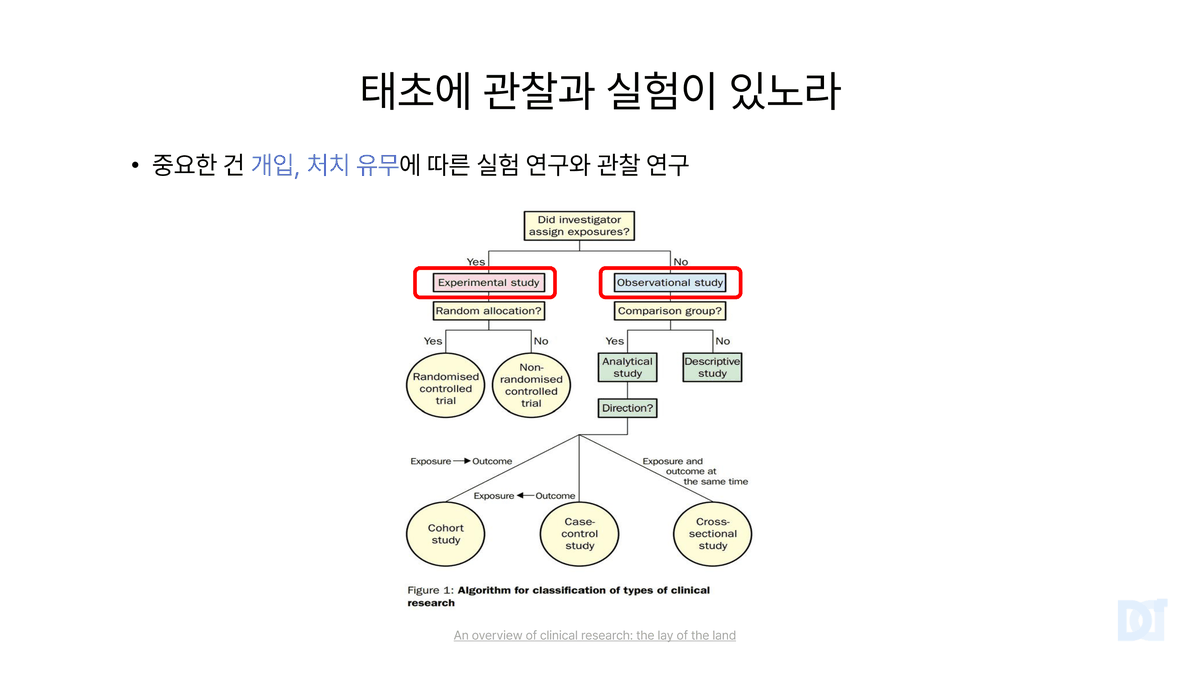
The essence of an experiment is that there is an intervention. You directly introduce what is presumed to be the cause and check whether it actually has an effect. The key is to set up only the presumed cause differently and keep everything else identical. If you hypothesize that white noise affects learning achievement, you turn white noise on and off and keep everything else fixed. The side without white noise is the control group, and the side with white noise is the experimental group.
Making the two groups equal
The core of experimental research is to construct two groups that are equal in everything except the intervention. If you turn white noise on for a group of men and off for a group of women, it is not a fair comparison. Gender becomes a source of bias. Beyond visible traits like gender, web and app services have many variables that affect outcomes. Matching them one by one is difficult, and that difficulty is the challenge of experimental research.
Randomization is magic
So randomization came along. It is simple but powerful. The experimental design framework established by Ronald Fisher (1890–1962) is the randomized controlled trial, or RCT. To control confounders, groups are assigned at random. When a participant arrives, you place them into the experimental or control group as if flipping a coin. If you assign randomly without asking about age, gender, or health status, then when there are enough people, the characteristics of the two groups become similar on their own.
I made a joke during the talk. Fisher’s close friend was William Gosset, and the distribution Gosset developed is also used in A/B tests. Whether making a good friend helps your career, or whether becoming a great person attracts good friends, you can decide for yourself.
Medicine is even trickier. On top of random assignment, whether a drug is real or a placebo is hidden from the researcher, who is a doctor, and from the participants. This is a double-blind design, and it exists to measure only the pure effect of the drug. This is the prospective analysis that pairs with the retrospective analysis mentioned earlier. Rather than analyzing data that already exists, you design the experiment first and collect data going forward.
The drawbacks of RCTs in clinical trials
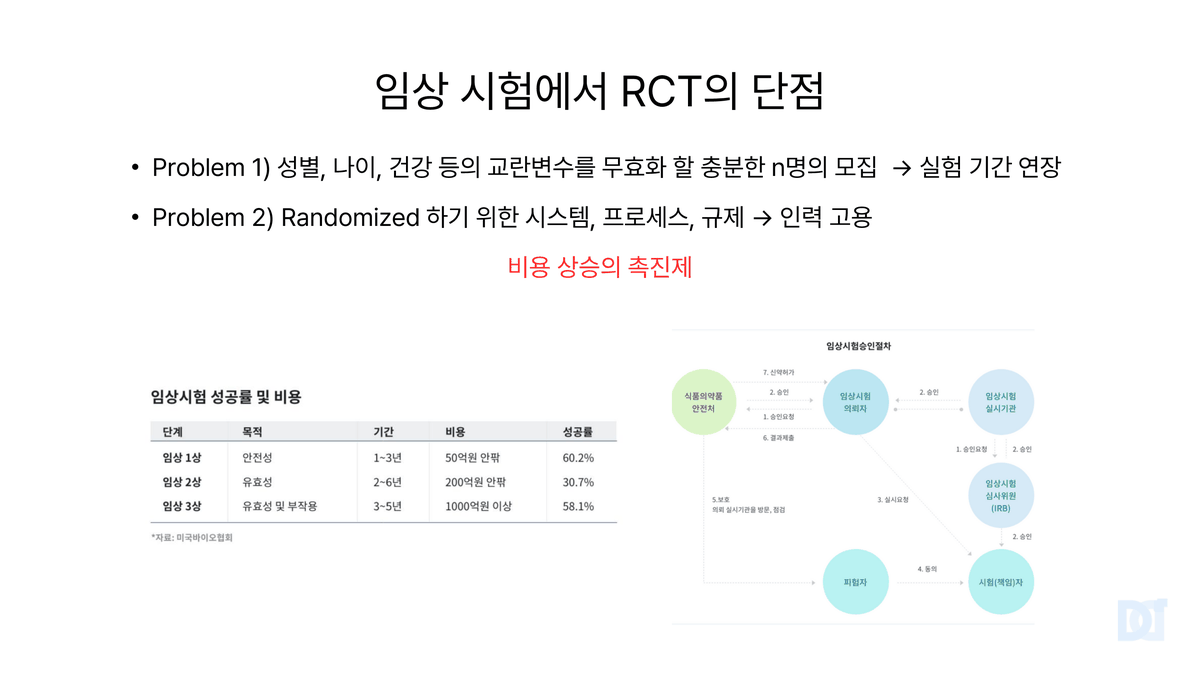
I have worked on this side, so I know the problems too. There are two.
| Problem | Details | Result |
|---|---|---|
| 1. Recruiting participants | Recruit enough n people to neutralize confounders such as gender, age, and health status | Longer trial period |
| 2. Systems and regulation | Systems, processes, and regulatory response for random assignment | Hiring staff, rising costs |
First, there are too many variables that depend on the person. For a cancer drug, women may have hormonal influences and older adults may have circulatory issues, so you need to recruit many people to neutralize these effects. New drugs, however, are usually narrow in scope. If a drug is used only for stage 3 lung cancer, just recruiting stage 3 lung cancer patients takes 2 to 3 years. In the table at the bottom left of the slide, the phase 2 trials people usually mention take 2 to 6 years, and phase 3 takes 3 to 5 years. Phase 1 is a safety test in healthy people, so it is separate, but overall development takes close to 10 years. And not everything succeeds.
Second, clinical trials are a regulated industry with many third parties involved. A pharmaceutical company might think it can simply run a clinical trial, but the process is complicated. Vendors step in to meet regulations, and you have to explain the concept and protocol of the experiment to hospital staff. Duration grows and costs rise.
The magic of the word ‘retrospective’
This is something I experienced while working in the field. To analyze National Health Insurance data, because it is data that people generated, you need approval from an institutional review board for clinical trials. These exist at the national level and at each hospital. When you submit a protocol, the reviewer may get angry: “A clinical trial can’t be this simple. Where is the subject consent form, and where is the drug safety data?” But if you say, “This is not a clinical trial. It is a retrospective study,” their expression softens. “Oh, I see. We’ll accept that much.” You pass. This shows how much simpler the retrospective study’s process is, and conversely, how heavy the RCT process is.
4. Experiments moved online: A/B tests
Applying the RCT concept online, as smartphones, apps, and the web emerged, gives you online controlled experiments (OCE). It is the same thing as an A/B test. Let’s look at how the two RCT problems play out online.
How the two RCT problems are solved online
- Problem 1. Recruiting participants Traffic is n Once the product matures and has enough users, n is secured, and experiments can be repeated
- Problem 2. Random assignment system SaaS or in-house build No consent forms, blinding, or ethics board required. Many experiment-tool SaaS products exist, and tech company blogs document in-house builds
First, in clinical settings, recruiting people was the problem. Online, it is easy. Once the product is mature and many people come in, a sufficient n is secured, and with many people you can keep repeating the same experiment. Second, I said a system for random assignment is needed. Online, there is no procedure like blinding researchers or obtaining subject consent forms. Many SaaS products help with A/B tests, and if you look at tech company engineering blogs, many posts describe in-house builds. The system is not that big a barrier.
So A/B tests become a prerequisite for continuously growing a service. They work well not in the stage of collecting data, but in the optimization stage, when you are already making decisions and want to go further. It is a quantitative way to move toward a better service: changing button placement, changing the search or ad engine, running recommendation systems, and revising UX writing.
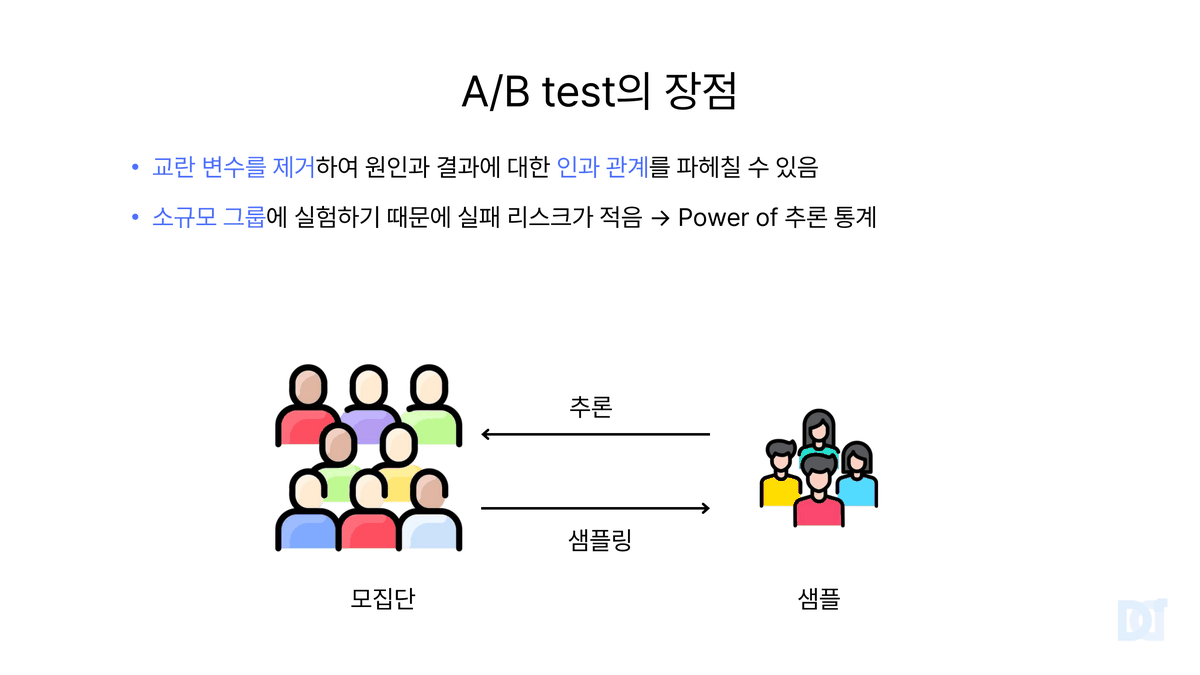
There are two advantages. One is that by removing confounders, you can dig into the causal relationship between cause and effect. The other is that because you experiment on only a small group, the failure risk is low. If you test on all app users at once, usability quality drops and the bad effects spread. The power of inferential statistics lies in not experimenting on the entire population, but applying the change only to a sample. If the result is significant and judged to have business impact, you roll it out to everyone. If not, you discard it.
Are there any downsides?
I like to look at both the pros and cons of any tool. There are situations where A/B tests are impossible.
| Case | Why it’s not possible |
|---|---|
| Probability-based items in gacha RPGs | One pull costs KRW 100,000, so giving different odds to different people causes strong backlash. Players share information, so experiments interfere with each other. South Korea requires disclosing drop rates, so it is impossible from the start |
| Optimal loan interest rate at a bank | Giving different interest rates to people with the same information violates financial regulations |
The first is games. If the probability of pulling a new high-performing character is 0.03% and one pull costs KRW 100,000, you could spend KRW 1,000,000 or even KRW 10,000,000. If you set different probabilities for different people in this situation, users will dislike it. Moreover, in games like this, information spreads well among users, so experiments interfere with each other. Above all, South Korea requires disclosing the probabilities of probability-based game items, so it is impossible from the start. The second is banking. If you give people with the same information different loan interest rates, the Financial Supervisory Service (South Korea’s financial regulator) will come knocking. In a regulated industry, you cannot do it.
5. When A/B tests aren’t possible: causal inference
What if you cannot run an A/B test? Should you just sit back? This is where causal inference comes in. A/B testing is also a part of causal inference, but the causal inference discussed here means using models such as linear models for quantitative improvement. The problem causal inference must solve is clear from this one question: in observational analysis where randomization is impossible, how do you control confounders? Ultimately, the key is to make the two groups, treatment and control, nearly exchangeable.
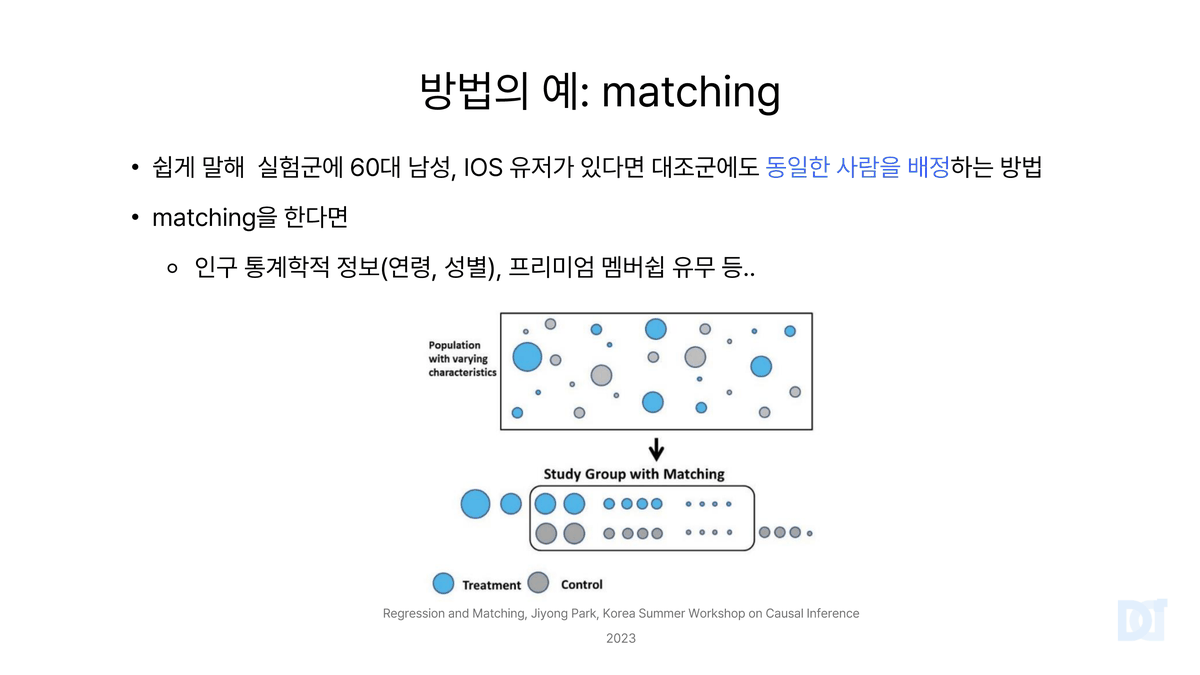
There are many methods. If I covered them all today, everyone would run away, so I’ll give just one example: matching. When data already exists, if the treatment group has male iOS users in their 60s, you assign the control group the same kind of person, so the two can be compared as if they were a single group. If you match demographic information such as age and gender, plus loyal-customer indicators such as premium membership subscription, you get groups that are reasonably comparable.
The drawbacks of causal inference
Of course, there are drawbacks.
| Problem | Details |
|---|---|
| 1. No confounder data to control | If gender and age are optional fields at sign-up, many people leave them blank. Without the data, there is nothing to control |
| 2. Not enough samples to match | There is an optimal ratio between treatment and control groups, such as 1 treatment to 4 controls. Without the data, matching is impossible |
| 3. Complicated assumptions of control methods | The assumptions of methods like PSM, IPW, and IV are difficult. Digging deeper, they end up as linear regression |
| Practical problem | Steep learning curve |
First, there may be no confounder data to control at all. If gender and age are optional at sign-up, many people, like me, skip them. Without this data, there is nothing to control with causal inference. Second, matching has an optimal ratio between treatment and control groups. If you have one treatment unit, you need to gather four control units, and without the data, this is impossible too. Third, the assumptions of control methods like matching are complicated. Dig deeper and you end up with linear regression. It is interesting, but difficult.
So the practical problem is that the learning curve rises steeply. The opening of one causal inference book says it assumes you know statistics, linear algebra, and machine learning, and that book already runs over 400 pages. I have seen many cases where people decided to just run A/B tests because the alternative was too hard.
6. Conclusion: where to start
This is the conclusion I reached after talking with many people, including colleagues who joined mid-career.
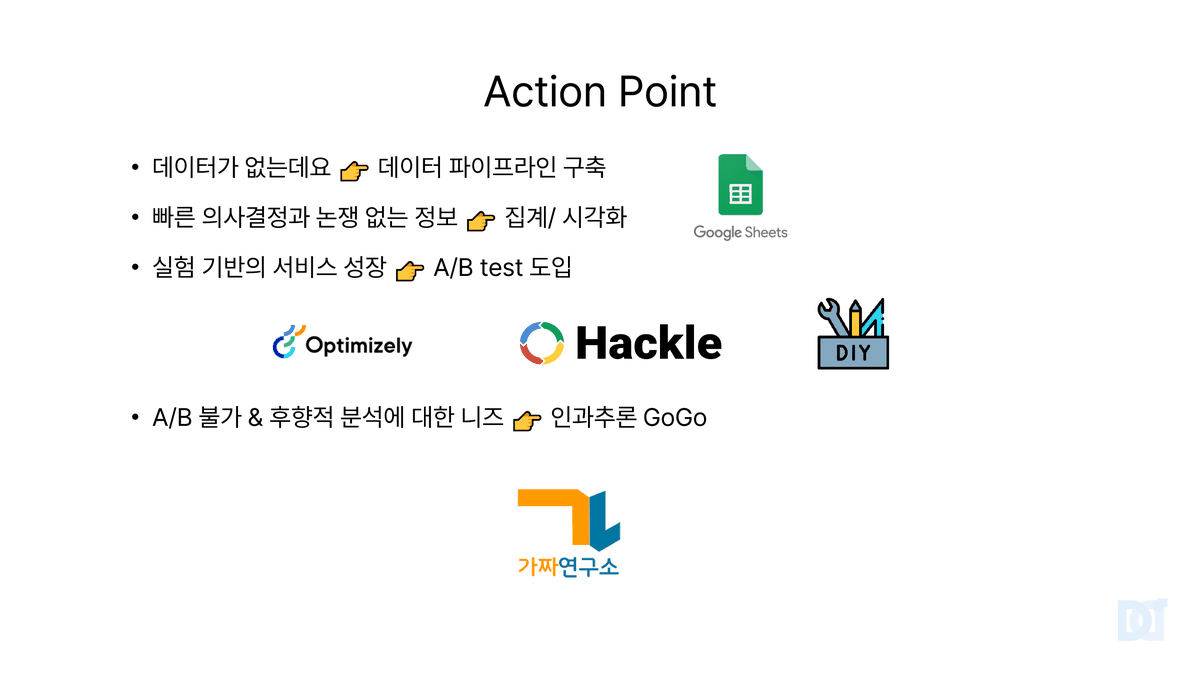
| Current situation | Next action | Tools mentioned in the talk |
|---|---|---|
| No data | Build a data pipeline | Google Sheets |
| Need quick decisions and information without debate | Aggregation and visualization | Google Sheets |
| Want to grow the service through experiments | Adopt A/B tests | Optimizely, Hackle, in-house build |
| A/B tests are impossible and retrospective analysis is needed | Causal inference | Pseudo Lab |
If you have no data, you need a pipeline. There is no denying that Google Sheets is a genuinely good product. You can use it as a kind of database, it can visualize data, and it works as a proof of concept (POC) for a culture where data flows. Quick decisions and information without debate are also aggregation and visualization, and nothing beats Google Sheets here either. In the end, everything comes back to Google.
When the product matures and you want to climb higher through experiments, adopt A/B tests. In the talk I mentioned Optimizely and Hackle. Hackle is an A/B test platform spun off from Coupang (a Korean e-commerce company). When I talked with someone there who works on statistics, it was well built. Some teams go further and build their own. If A/B tests are impossible and you’re curious about retrospective analysis, go to causal inference. The content is difficult and there are almost no SaaS tools for it. In Korea, Pseudo Lab (a Korean data science community) works in this area, and I watched their YouTube channel a lot.
7. Book recommendations
During the talk, I introduced three books that helped me study.
| Topic | Book | What I said in the talk |
|---|---|---|
| Statistics, machine learning | Practical Statistics for Data Scientists, 2nd edition (Korean edition from Hanbit Media, a Korean publisher) | The fundamentals |
| A/B testing | Trustworthy Online Controlled Experiments (Ron Kohavi, Diane Tang, Ya Xu, Cambridge University Press) | The bible of A/B testing. Reading just the first chapter or two is enough |
| Causal inference | Causal Inference in Python (Korean edition from Hanbit Media) | Hard but fun. I also skipped some sections partway through |
References for the talk
- An overview of clinical research: the lay of the land, Grimes and Schulz, Lancet 2002 (classification diagram from chapter 3)
- “Why is ‘A/B testing’ essential for customer-centric product improvement?”, Bang Taemo, Yozm IT (a Korean tech news site)
- Simpson’s Paradox and Confounding, Choi Bokyoung, Medium
- PS matching (Propensity Score matching), Medical Paper Cheat Key (a Korean medical-research blog)
- Causal analysis overview: Causal inference versus experimentation versus causal discovery, Ganga Meghanath, Medium
- Regression and Matching, Jiyong Park, Korea Summer Workshop on Causal Inference 2023 (matching lecture video: Week 3-4)
- Demystifying A/B Testing in Machine Learning, Dagang Wei, Medium
- Icons: flaticon
This article is based on the captions and 33 slides of the 2025 Data Yanolja talk video. No examples or numbers that were not in the talk were added. Last checked: September 9, 2026.
Frequently asked questions
- Why do A/B tests need random assignment instead of observed data?
- Observed data cannot separate cause from effect because of confounders. Random assignment, like a coin flip, places participants into experimental and control groups, which removes confounders.
- What is a confounder, and how can it mislead data analysis?
- A confounder is a variable that affects both the cause and the outcome. In the Office 365 example, heavy users hit more errors and also stayed longer, so errors appeared to reduce churn.
Want the full system? The Claude Code & Codex Skills guidebook collects the skills and subagents behind this blog, from $19.
BuildnWrite helps teams build AI agents that keep running. About BuildnWrite ›