Comparing 7 Ways to Build 5 Slides: The Most Expensive Scored Lowest
Who this is forAnyone considering making presentation slides with AI, and anyone deciding whether to keep maintaining their own slide generation code.
TL;DR: I made the same five slides seven different ways and measured cost, time, and spec compliance. Comparing only the amounts actually billed, there was a 6x gap between $0.67 and $4.07, and the more expensive path followed the spec the least. Adding subscription cost divided by usage as a converted figure widens the gap to 45x. There is also one difference my scoring rubric cannot catch, so I added another axis to measure.
The number of tools for making presentation slides has exploded. For several months I have been building and using a slide generator with python-pptx. Looking at the tools coming out now, I keep wondering whether I should keep refining this code.
So I measured it. I made the same five slides seven ways and got numbers for how much each cost, how long it took, and how well it followed the spec I set.
Contents
- Experiment design
- Results: the most expensive path did the worst
- Image generation follows the color codes
- What my scoring rubric missed
- Where Canva MCP broke down
- Building costs and fixing costs are different
- Summary
Experiment design
For the comparison to hold, all seven paths need exactly the same input. I pinned the 35 slide text strings in one file and fixed the prompt in one file. The only thing that differs between paths is the final paragraph, which says “make it this way in this tool.”
- PSubject
- Five slides from "How AI and Agents Differ" (cover, cycle diagram, comparison table, big number, closing), 35 text strings
- IWhat changed
- Six production paths: codex built-in image_gen, Gemini nano-banana-pro, Canva MCP, Genspark standard, Genspark Ultra, Claude Design
- CBaseline
- Self-built python-pptx generator, code I refined over several months. Whether there is a reason to keep maintaining it is the question of this experiment
- OMeasured
- Cost (USD, with accounting-basis notes), time in seconds (from submission until spec met), string accuracy (checked against 35 strings), background color error (RGB distance), share of off-spec chromatic color, shape fidelity to the requested form (visual judgment, an axis added after seeing the results)
- TPeriod and runs
- As of September 9, 2026, second round with color codes included. One main run per path (retry cap of 3, 30-minute cap per path). Fix runs were done once each on four paths only
- Not controlled
- The 8-color palette is my generator's default, so the control group gets color points for free. The several months spent on the generator are not counted in production time. Run order was fixed, so I became more familiar with the tools as the runs went on. Only Claude Design was operated by hand in the app, so its time is not measured on the same ruler. Genspark's export is paid, so I scored it by capturing the screen
I record the uncontrolled variables openly because that is where the conclusion can change. Why this distinction matters is covered in more depth in why A/B testing was born, which discusses confounding variables and randomization.
The five slides are built around the topic “How AI and Agents Differ.” There is one cover slide, one cycle diagram slide, one three-column, five-row comparison table slide, one big number slide, and one closing slide. I deliberately mixed tables, diagrams, and big numbers because that is where each tool’s inability to build a particular form shows up.
Scoring was done mechanically on two things. The first is string accuracy: I extract text from the output and compare it against the original 35 strings. The second is color compliance: I pull the most frequent colors from the PNG pixels, measure their distance from the spec background color, and count what percentage of the screen is chromatic color outside the 8-color spec palette.
Results: the most expensive path did the worst
| Path | Cost | Time | Background color error | Off-spec color | Shape fidelity |
|---|---|---|---|---|---|
| Self-built python-pptx | $3.77 actual charge | 287 s | 0.0 | 0.6% or less | Partial |
| codex built-in image_gen | $0.65 converted | 200 s | 2.2 or less | 1.4% or less | Met |
| Gemini nano-banana-pro | $0.67 metered | 150 s | 7.0 or less | 0.5% or less | Met |
| Canva MCP | $4.07 actual charge | 390 s | 22.7 | 19% or more | Not met |
| Genspark Standard | $0.09 converted | 180 s | 1.0 | 0.9% or less | Not met |
| Genspark Ultra | $0.16 converted | 500 s | 1.0 | 0.6% or less | Met |
| Claude Design | Not measured | 348 s | 0.0 | 0.9% or less | Met |
I left string accuracy out of the table because all seven paths got a perfect score. Garbled Korean text or changed wording never happened once. What did differ was whether the spec was followed.
Only Genspark is billed in credits. The account I actually ran was on the Free plan, so actual cash spent was $0. Counting only credit deductions, the standard tier used 35 credits for five slides, and the Ultra tier used 65 credits for five slides. To convert this to dollars, I need the paid plan’s unit price. The official pricing page lists Plus at $24.99 per month for 10,000 credits per month, which works out to $0.0025 per credit. So 35 credits is $0.09 and 65 credits is $0.16. Paying annually brings the monthly price to $19.99, which lowers it further.
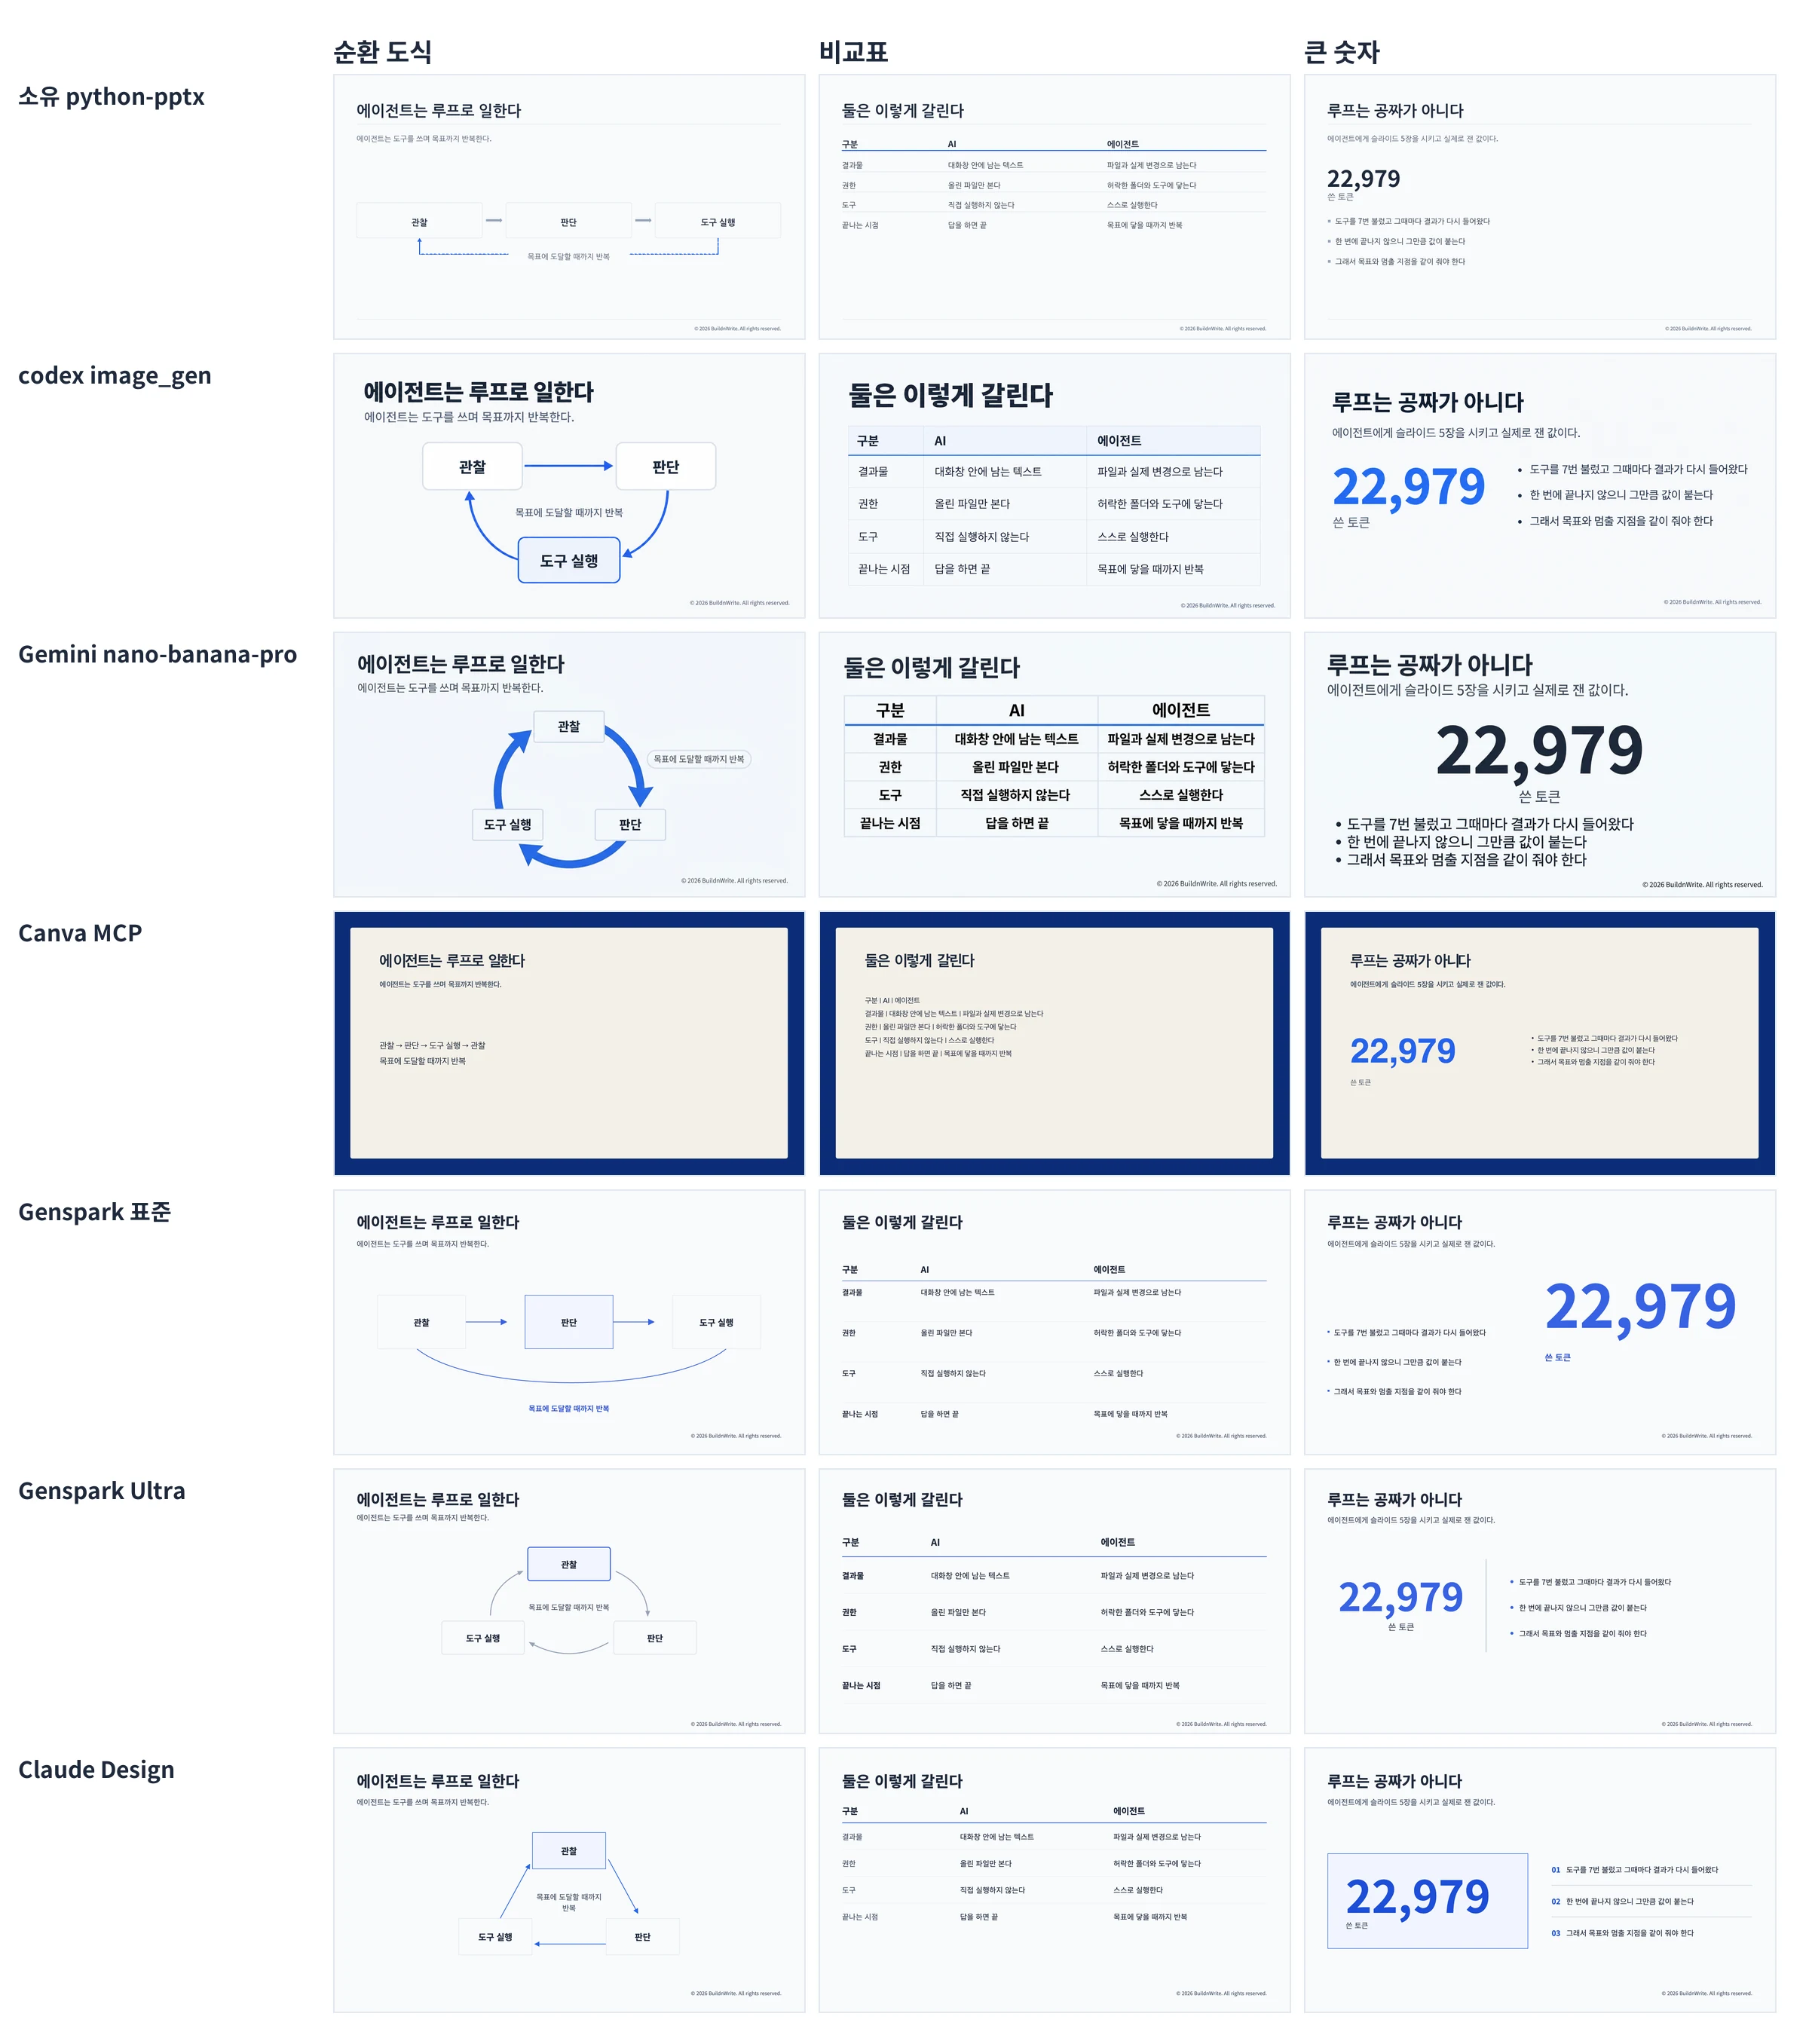
Image generation follows the color codes
This is the biggest prediction I got wrong in this experiment. I expected that giving an AI image generator a color code like #2563EB would produce a roughly similar blue. In practice, it drew the table header background fill and the blue underline beneath it exactly to spec.
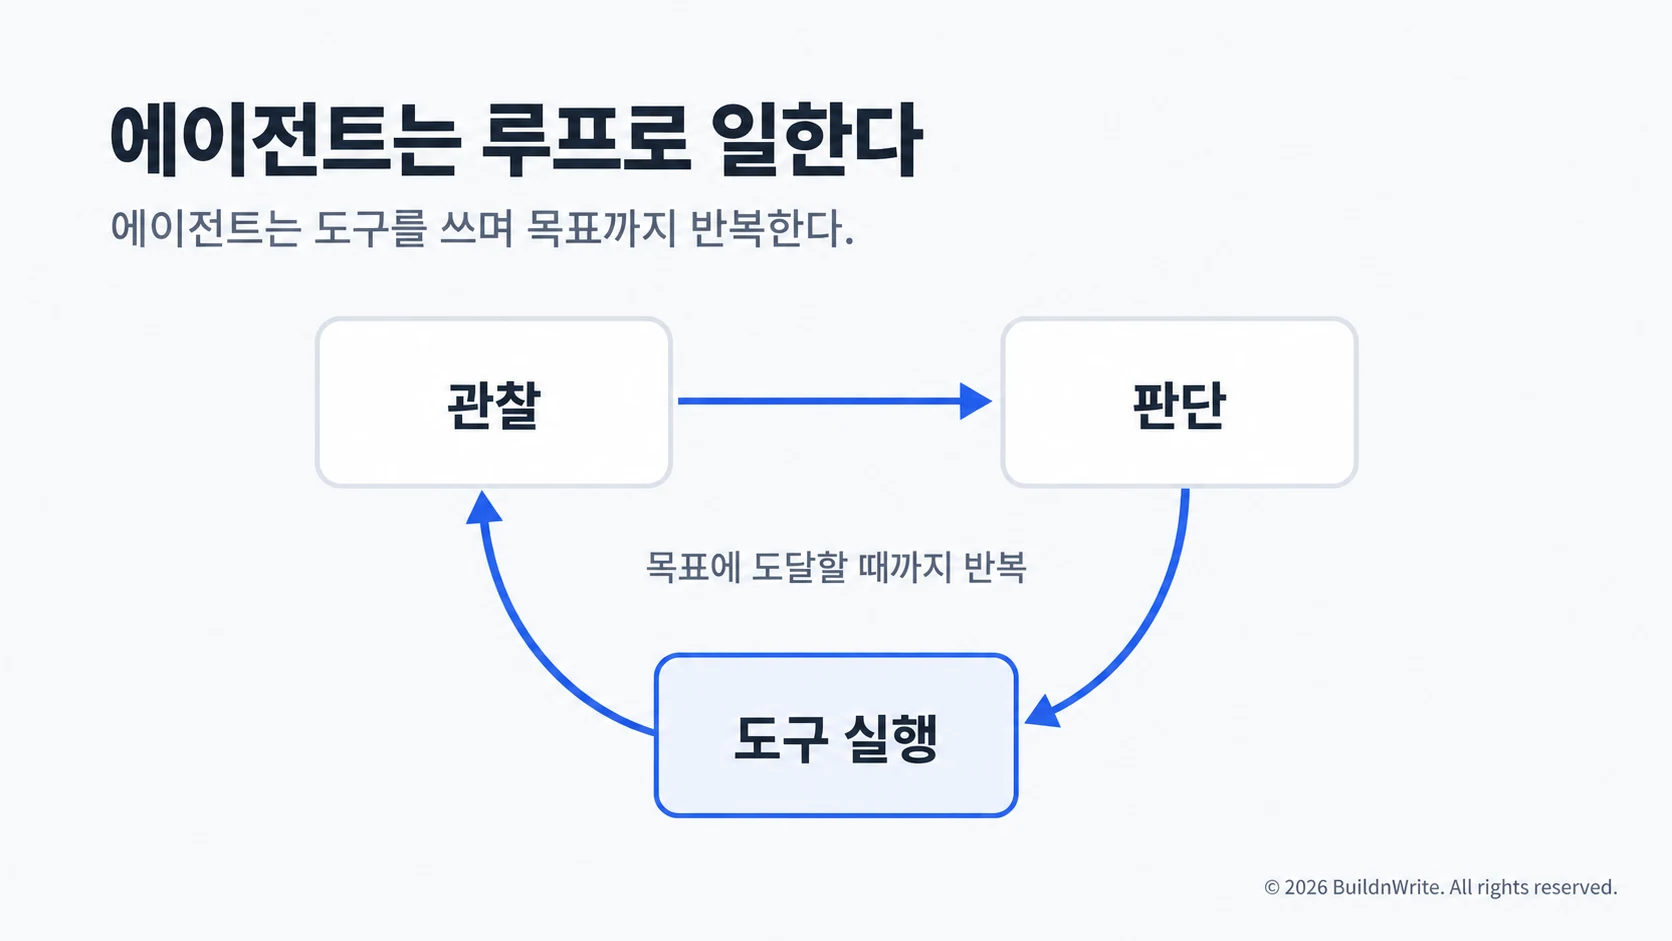
I want to state the path name precisely. Calling it “GPT image generation” would be wrong. This path runs codex CLI 0.153.4 with the gpt-6-astra model, and the picture was drawn by codex’s built-in image_gen tool. gpt-6-astra is the model that receives instructions and calls the tool, not the model that draws the image. The logs do not record which image model the built-in tool uses behind the scenes, so I did not record an image model name. The other path has a clear name: I called the Gemini API directly and specified nano-banana-pro-preview.
This cycle diagram is also a shape my own code could not build. The diagram types registered in my generator are only straight arrows, so drawing a loop required extra helper code. Owned code has to be modified every time it hits a form outside its vocabulary, and that is the maintenance cost.
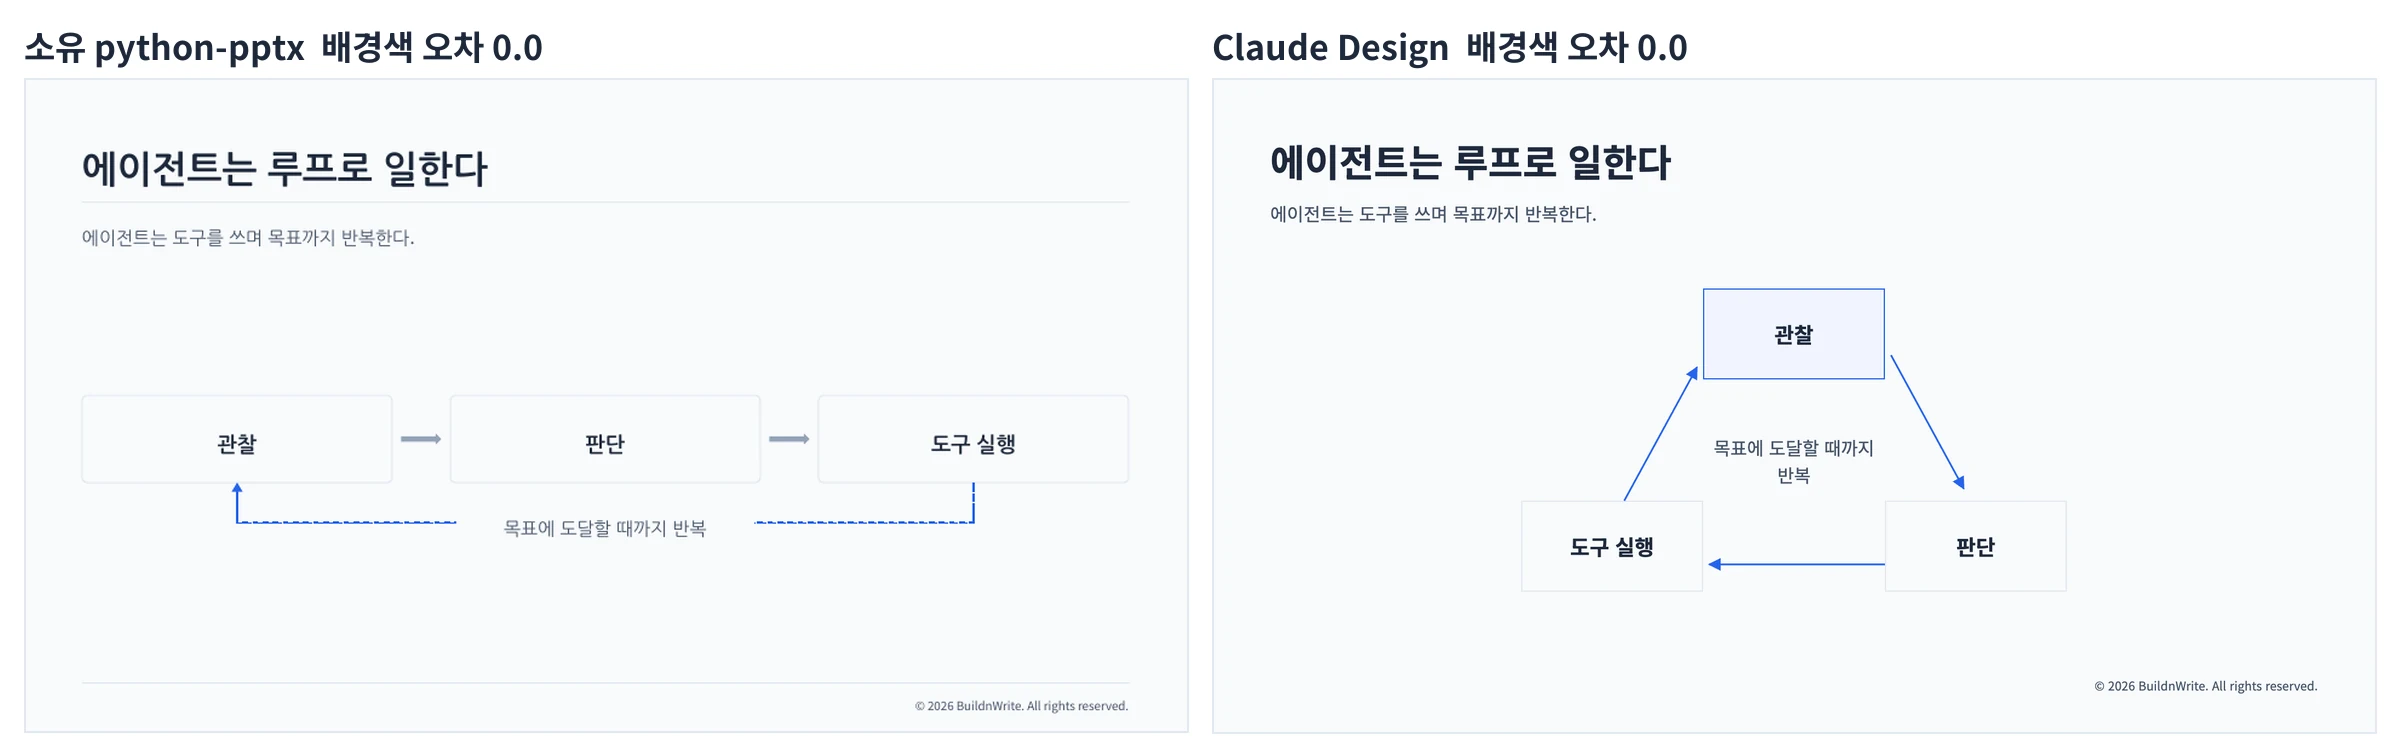
Here is the result that hurt most for my generator. Only two paths got a background color error of 0.0: my own code and Claude Design. On the palette, Claude Design actually used all eight colors, while my code used seven. It matched the colors as precisely as my code did, and it also built a loop my code could not. The advantage that months of refinement had bought my code was accuracy, and that advantage did not hold here.
The two paths that drew images, codex and Gemini, get different notes. Both failed to meet the requested resolution. Codex reported this itself:
Resolution requirement not met. I requested 1920×1080, but the tool returned 1672×941. Code rendering was not used.
Also, because the output is an image, I cannot mechanically extract and verify the text. That means I cannot automate proofreading for typos.
What my scoring rubric missed
Judged by the rubric alone, the two Genspark tiers produced the same result. So I concluded that what the more expensive tier bought was just more retries, not a better design. That is, until I put the outputs side by side.
When I ran Genspark in the standard and Ultra tiers, all the original dependent variables were effectively tied. Background color error was the same at 1.0, palette hit rate was the same, and required elements were 5/5 for both. But when I looked at the outputs side by side, they differed.
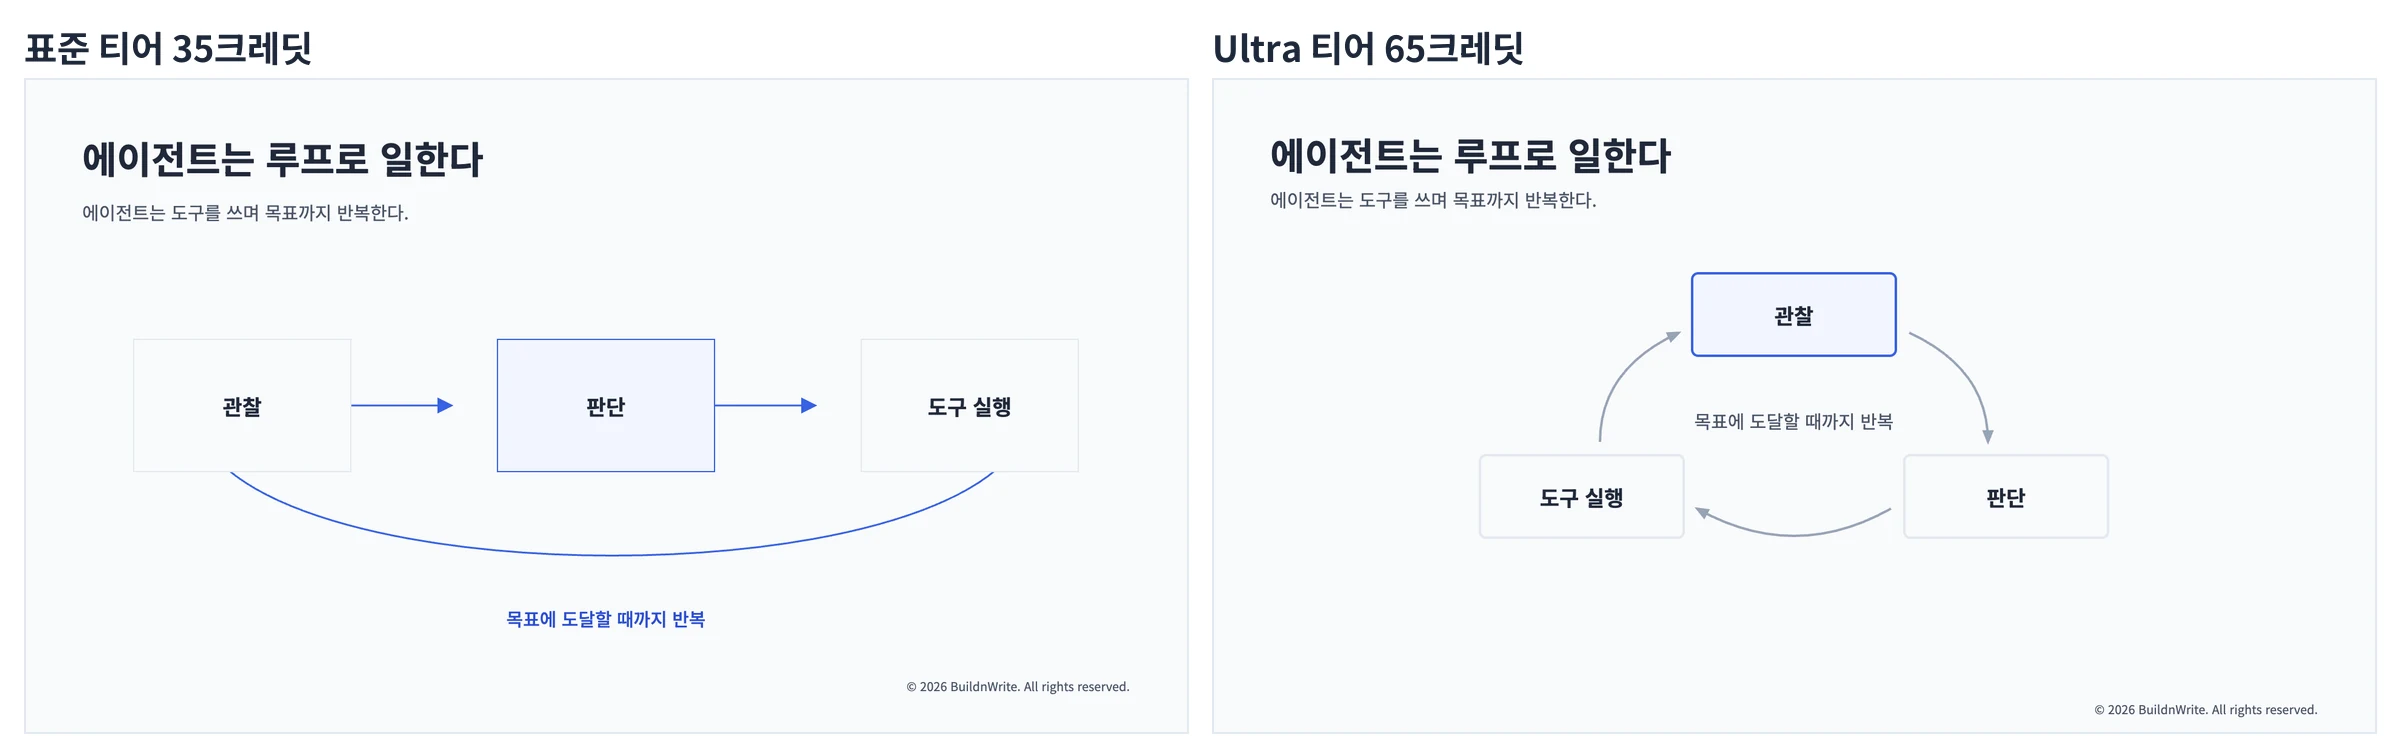
The problem is that the required-elements check only counted whether something existed. It asks “are there three boxes?” but not “are the boxes arranged in a loop, with an arrow returning from the last box to the first?” So the version that lined the boxes up in a row and drew a curve without an arrowhead also received a perfect score.
So I added another dependent variable: shape fidelity. For slides where the spec specifies a form, I check three things.
| Check | Condition for “not met” |
|---|---|
| Three boxes exist as shapes | Replaced by a text list |
| Arrangement is a loop (circle or triangle) | Straight single-row arrangement |
| Arrow from the last box back to the first | Line without an arrowhead, or none |
Re-scoring with this lens changed the ranking. codex, Gemini, Ultra, and Claude Design are met. Self-built code is partial. Genspark Standard and Canva are not met.
The more expensive tier did not buy only more retries. Retry differences did exist. The standard tier’s comparison table overflowed the bottom of the screen by 189px, so its self-check loop ran twice and it fixed the overflow itself. Ultra produced all five slides with no overflow on the first attempt. On top of that, the diagram’s form matched the spec better.
If 65 holds, the difference between standard and Ultra is $0.09 versus $0.16, a gap of $0.07. At that level, I would skip standard and go with Ultra. The standard tier fails to match the form on slides that include a diagram, and the cost of rerunning to fix that exceeds $0.07. The trade-off is that Ultra is 2.8x slower, so for urgent work I would use standard.
Where Canva MCP broke down
It was the most expensive path and took the longest, yet it produced the worst results. The cause was the structure of its editing API.

What the Canva editing API provides is text replacement, element deletion, position and size changes, styling, and image filling. There is no feature to add new elements. So you can only reuse elements that already exist in the template produced by automatic generation. If the template has no table or shape, there is no way to build that slide. There is also no feature to change the background color, so the template’s dark navy was carried over as-is.
Building costs and fixing costs are different
What actually eats time in practice is not the first build but the fixes. So I asked for one table row to be added to the finished five slides. This fix run was done only on four paths. I did not measure fixing costs for the two Genspark tiers or for Claude Design.
| Path | Fix cost | Time | Result |
|---|---|---|---|
| Gemini nano-banana-pro | $0.134 | 24 s | Row added. Footer contaminated |
| codex built-in image_gen | $0.83 | 150 s | Row added. No effect on other slides |
| Self-built python-pptx | $1.21 | 68 s | One line of data fixed, then rebuilt |
| Canva MCP | $1.75 | 110 s | Row added. Since it is text rather than a table, only one line was added |
My prediction was off here too. I expected that regenerating an image would make its tone clash with the other slides, but the background color shift was within 0.2. That is not distinguishable by eye.
Instead, a different problem appeared. Gemini added the row correctly, but the design spec instructions leaked straight into the footer.

Noto Sans KR, 20px, #1E293B. came out attached. The instructions leaked into the output.Image generation has no boundary between instructions and content. A spec written into the prompt can appear as text inside the picture, and there is no mechanical way to catch it.
Summary
This post is one entry in an experiment log that runs every two weeks. In the next installment, I plan to measure other tasks the same way. You can see just this series on the Experiment page.
Frequently asked questions
- What was the billed cost gap between the cheapest and most expensive paths?
- Counting only amounts actually billed, the gap was about 6x, from $0.67 for Gemini nano-banana-pro to $4.07 for Canva MCP.
- Did the Canva MCP path follow the slide spec?
- No. Canva MCP had a background color error of 22.7, 19% or more off-spec chromatic color, and did not meet the shape fidelity requirement.
Want the full system? The Claude Code & Codex Skills guidebook collects the skills and subagents behind this blog, from $19.
BuildnWrite helps teams build AI agents that keep running. About BuildnWrite ›